S&P 500 Golden Cross – July 3, 2025
We are witnessing an extreme risk-on rally.
The S&P 500 golden cross has triggered.
Just 3 months ago, few could entertain the thought of a face-ripping rally. Pundits proclaimed another 2008-style meltdown was in order.
They were wrong…massively wrong.
In fact, one of the steepest rallies in history occurred.
Fortunately for MoneyFlows, we were armed with data that forecasted a positive situation.
We’ve been on record many times saying that the 2025 tariff crash mimics the 2020 COVID-19 crash to a tee. That’s the real analog that most missed this year.
And the latest golden cross formation will only cause more pain for the bears over the medium term.
Over the near-term, we are inching closer to a potential blowoff top that will bring a healthy reset for equity prices.
Those who have missed out on the monster rally will want to have this single indicator on their radar in the coming days and weeks.
Let’s now review the money flows landscape.
S&P 500 Golden Cross
You need to look backwards to see the future.
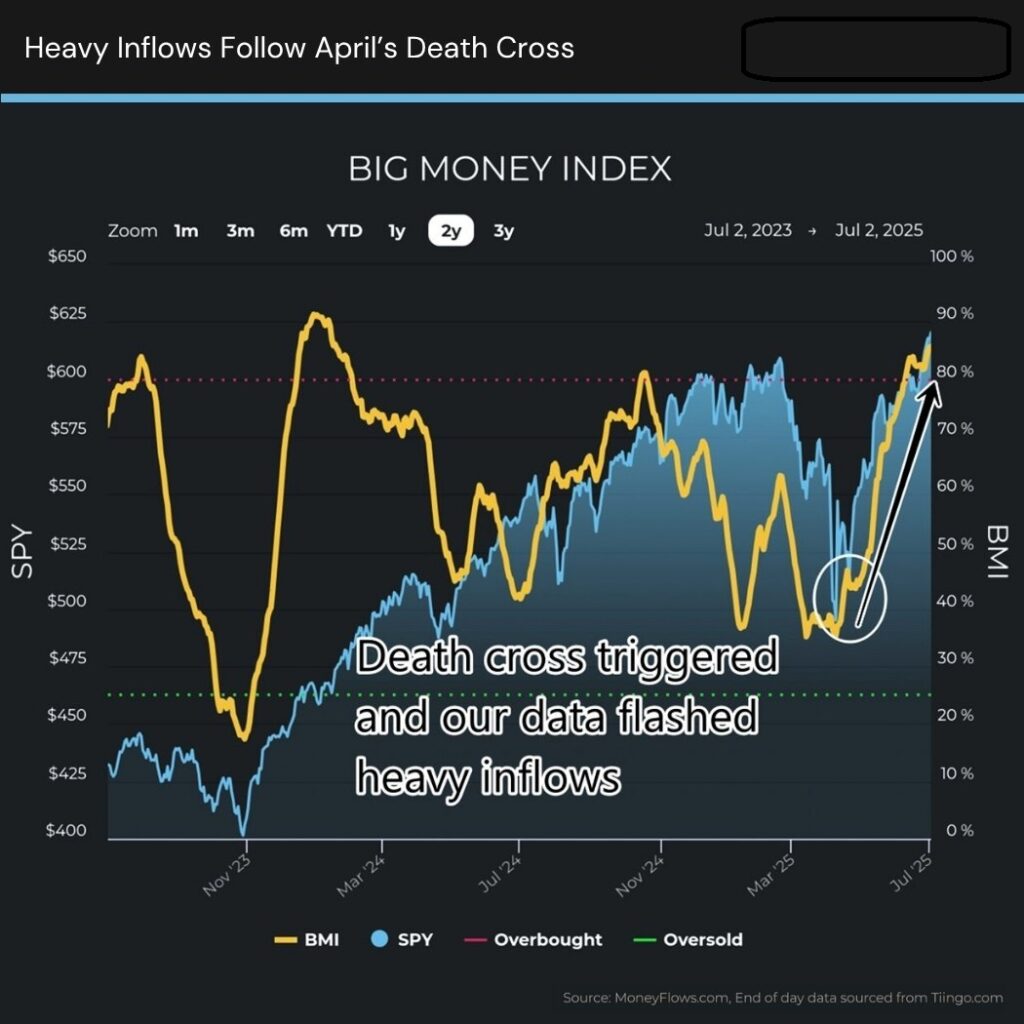
In early April the S&P 500 formed a death cross. That’s when the 50DMA falls below the 200DMA.
The prevailing narrative at the time was how this was a negative omen for equities. That wasn’t true. We proved it was a bullish signal.
You can review the powerful signal study in that piece above.
More importantly, our most popular breadth indicator the Big Money Index (BMI) started rallying hard, indicating money was being put to work.
Good luck shorting a ripping BMI. Here’s what happened to the S&P 500 when the death cross triggered:
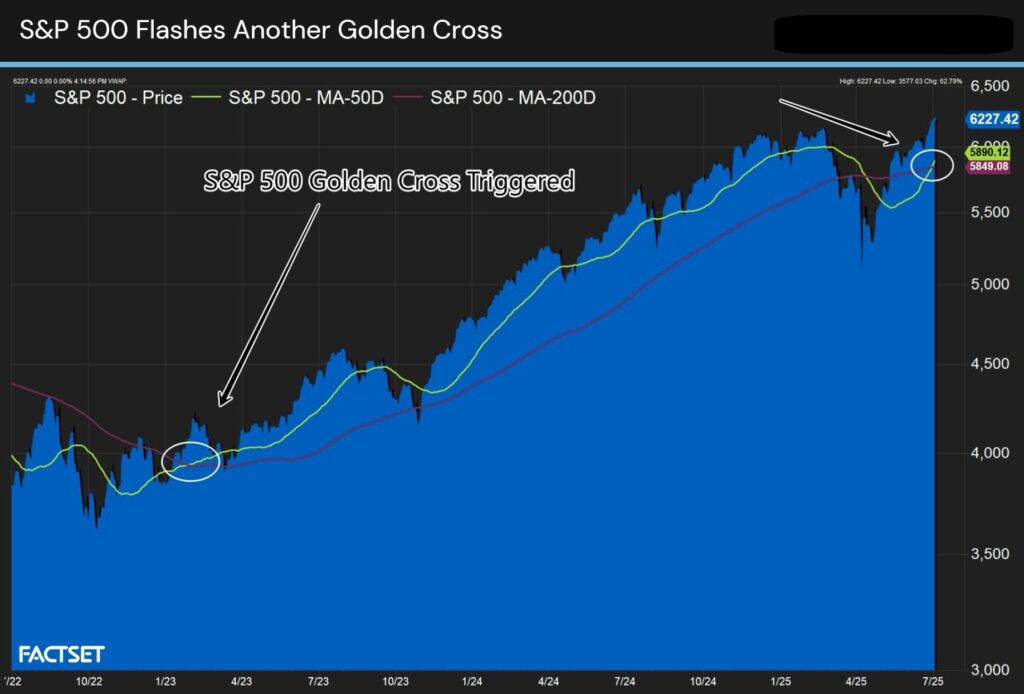
The rally has stunned everyone. Just last week the NASDAQ formed a golden cross and we discussed how that’s a positive omen.
Now we are staring at another golden cross, this time it’s with the S&P 500. Below you will notice the last time this signal flared was in January of 2023:
The million-dollar question is what comes next?
Turns out, more gains.
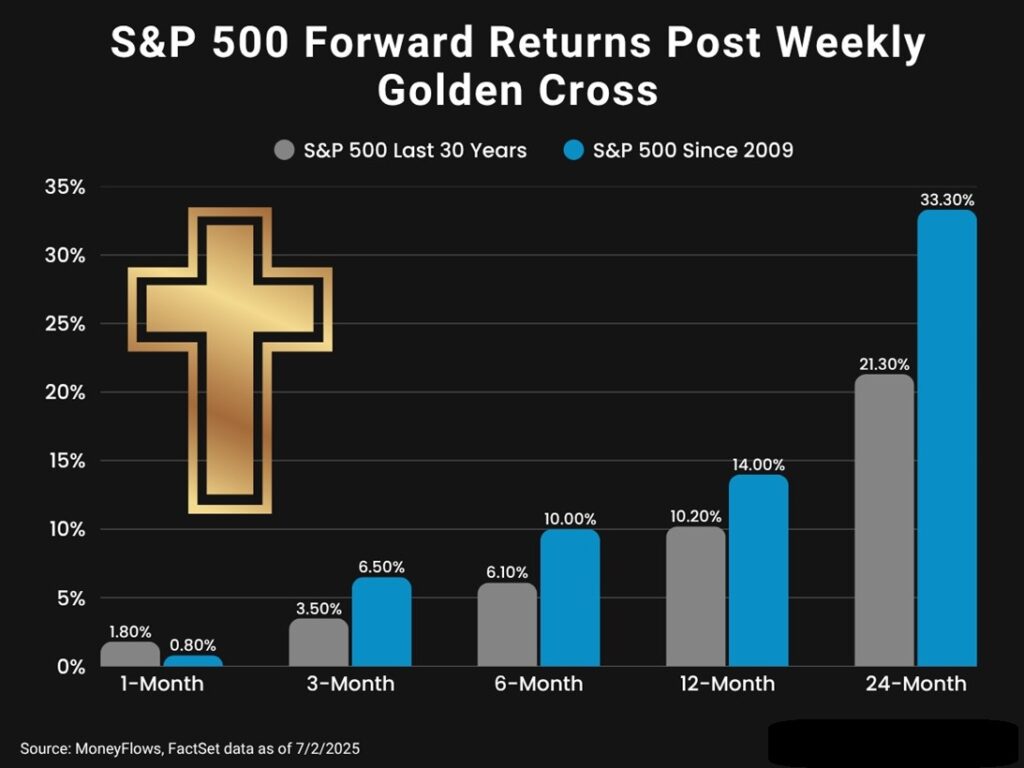
Using weekly data going back 30 years, we found 14 prior golden crosses. Stocks have done moderately well.
Since 2009, this has been a market-beating signal with:
- 3-month gains of 6.5%
- 6-month average gains of 10%
- 12-month gains of 14%
- 24-month gains of 33.3%
Hug a bear! They’ll need it.
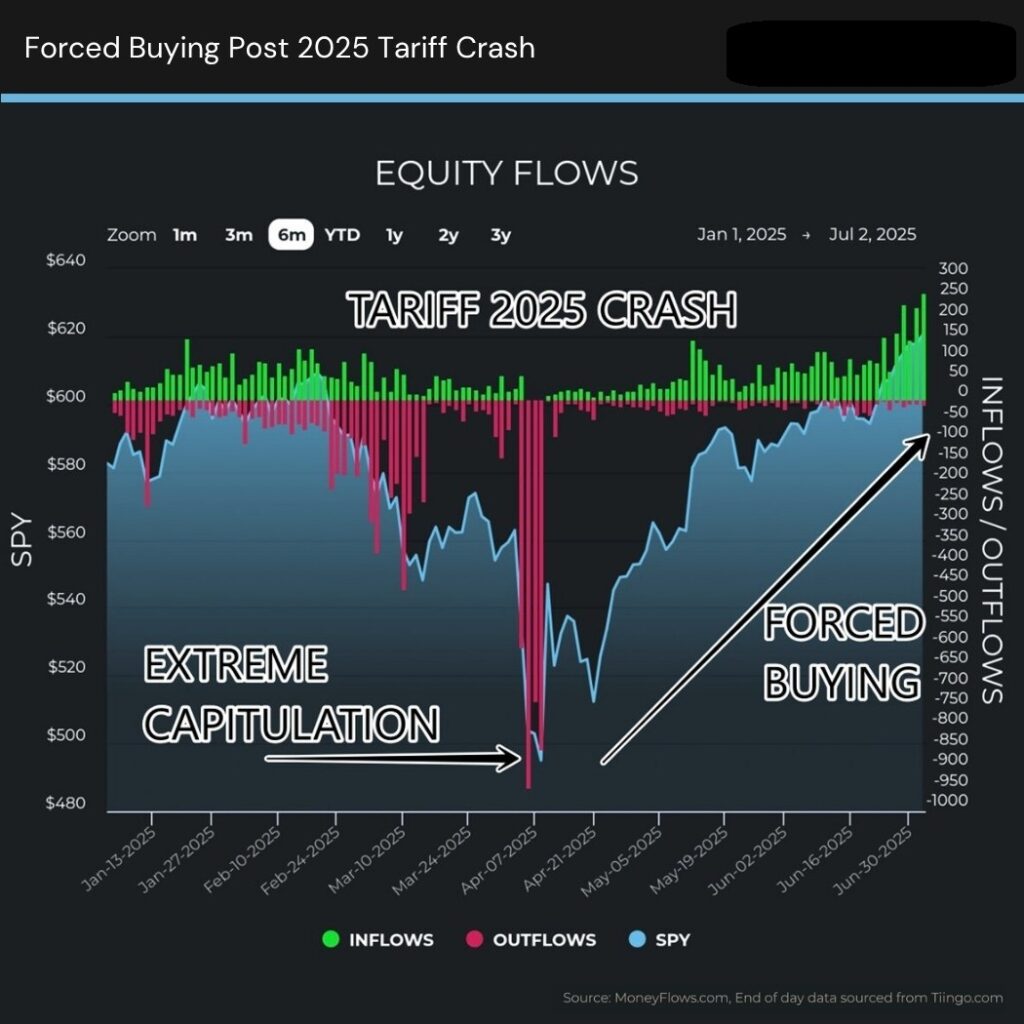
Now it’s important to put this signal into perspective. We are witnessing forced-buying by investors, which we told you to expect 2-months ago.
Forced-buying occurs when institutions derisk and have to play catch up to keep up with indices.
In 2020, extreme capitulation triggered forced buying by investors. You can see this pattern vividly in our data:
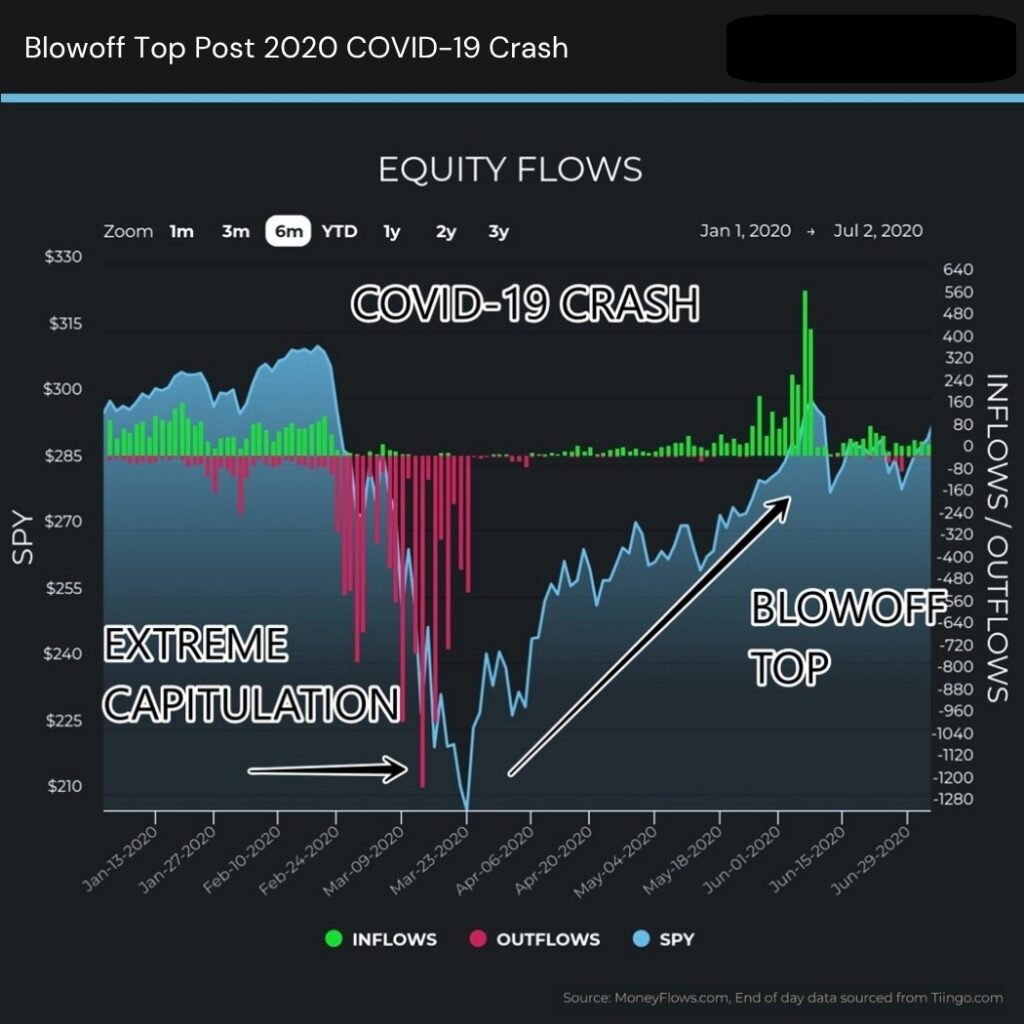
This is the same pattern shaping up in 2025.
Not the similarity to the COVID-19 crash then relief rally. We are now seeing the largest equity inflows all year:
Obviously, the current magnitude of today’s inflows can’t last forever. We have a signal that will guide you once a blowoff top triggers.
Anytime we see 400+ equity inflows, it marks a Forced Flow Trigger (FFT) defined as a blowoff top.
Below highlights the last FFT signals which occurred in November 2024, December 2023, and February 2023:
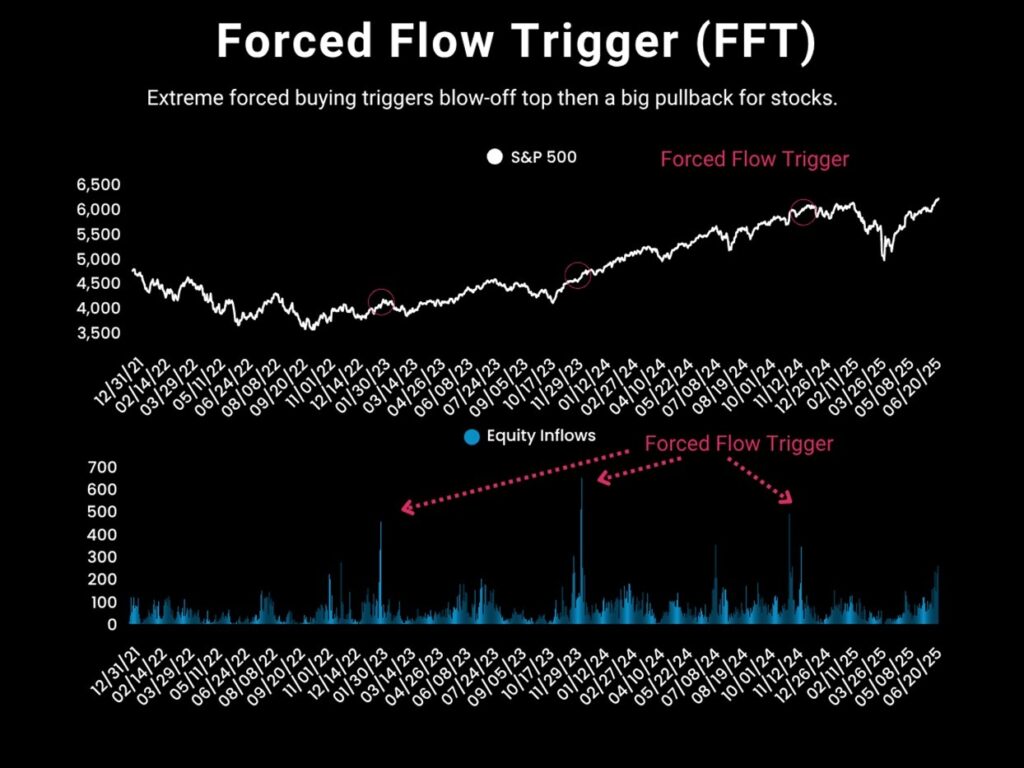
Using the eyeball test this may appear as insignificant. However, zoom in and you’ll see a breathtaking rally leading into a Forced Flow Trigger followed by a violent selloff afterwards.
This is how you can visualize a blowoff top in real time.
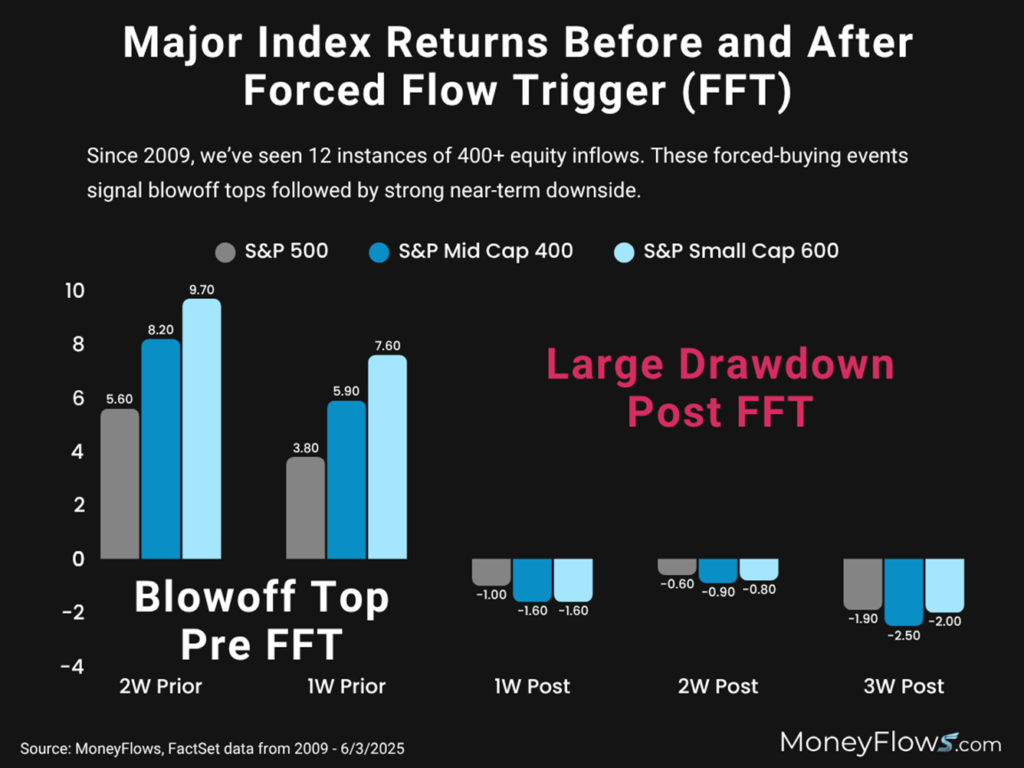
Heading into a Forced Flow Trigger (FFT), major indices rally hard in the 2-weeks prior then fall in the 3 weeks post a blowoff top:
Here’s the bottom line:
The S&P 500 formed a golden cross. This is a very positive indication for upside over the medium term.
In this environment, outlier stocks massively outperform, especially the names listed on our weekly Outlier 20 report.
But also be aware that if a blowoff top triggers, a healthy reset will follow. If major indices fall 4%, growth stock will fall 10%+.
It’s so important to be on alert given the forced buying occurring now.
Author: Lucas Downey