Stocks are Overbought – June 12, 2025
The unthinkable happened.
2 short months ago, stocks recorded record outflows.
Fast forward to today, stocks are overbought.
I’ve said it before, and I’ll say it again. Rarely does the crowd get rich together.
It takes a data-driven action plan to create the courage to entertain unconventional ideas.
And the fun isn’t over yet.
My call for a blowoff top is still very much in play. As I see it, the biggest risk to portfolios near-term remains to the upside…not the down.
Uttering the words overbought conditions may ignite fears of pain ahead. But that’s incorrect.
Historically, markets tend to stay in the red zone for an extended period of time…like the bonus round in a video game.
Portfolios and action characters can rack up a lot of points in the bonus level…you don’t want to miss it!
It’s when stocks fall out of overbought conditions that trouble brews.
Before we get to that signal study. Let’s unpack where the Big Money picture stands.
We’re in a raging bull market.
Stocks are Overbought
It’s important to revisit the past in order to understand the future.
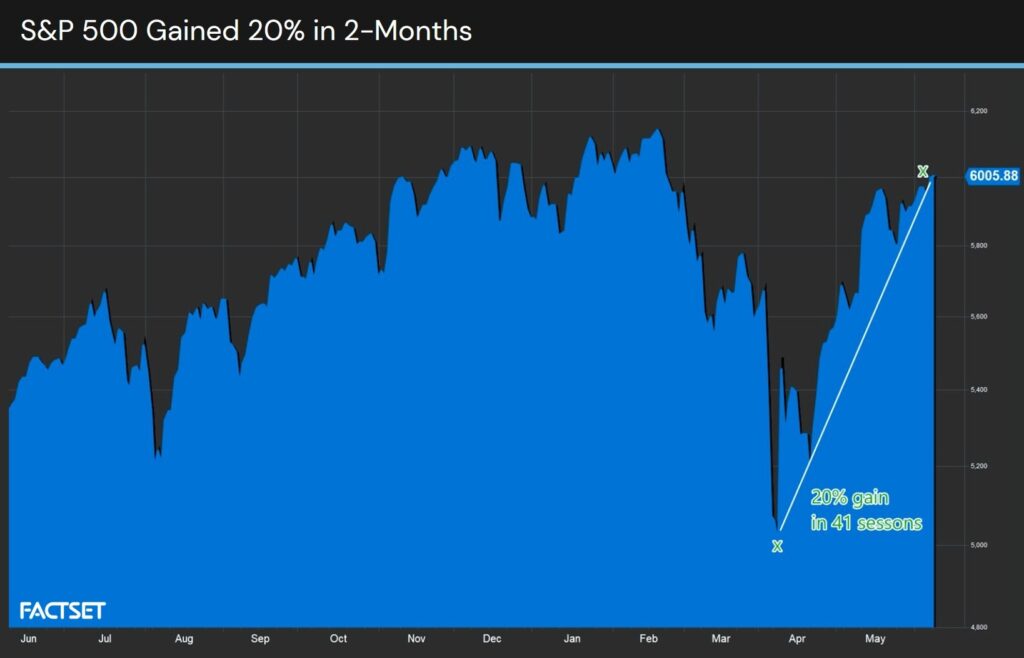
At the market low on April 10th extreme fear gripped investors. We built the non-conventional case that a breath-taking rally was coming.
Here’s a snapshot from that trying time:
The unthinkable idea was how a risk-on environment was in short order.
It didn’t disappoint. The S&P 500 had one of its best 2-month performances ever in the last 40 years with a 20% rally:
When you review this mega-rally through the lens of the Big Money Index (BMI) you realize just how explosive the inflows are.
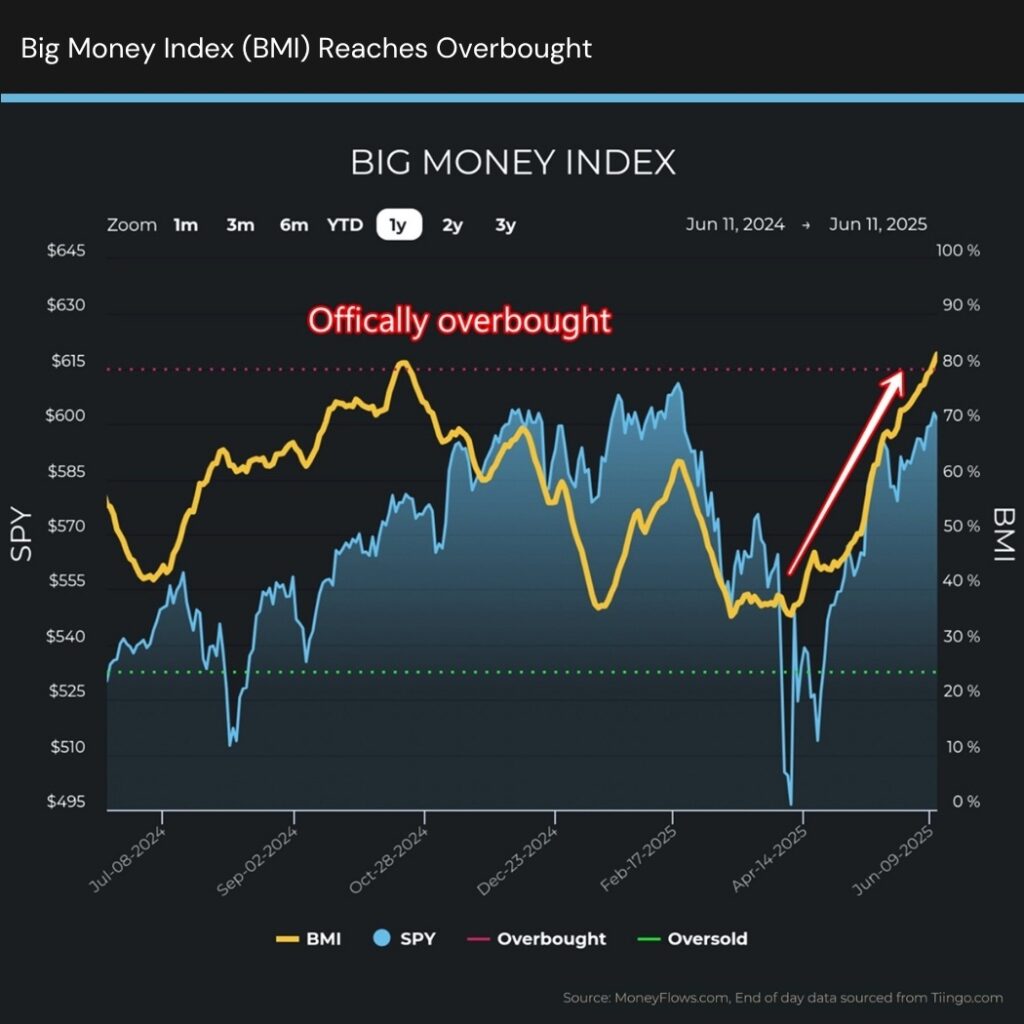
It’s been a while since we’ve seen a rally of this magnitude.
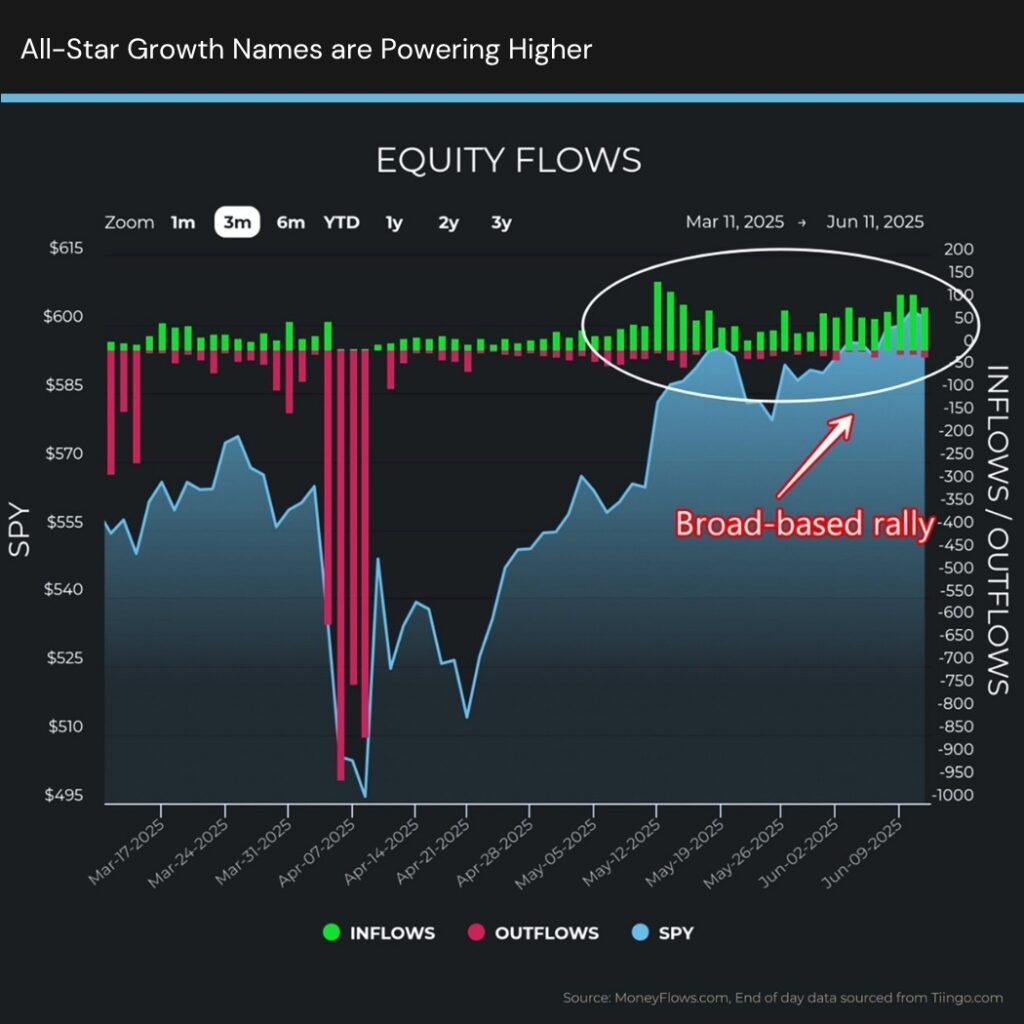
Diving below the surface reveals a startling truth. It’s broad-based participation.
Even yesterday saw tons of stocks getting accumulated. All-star growth names are powering higher day after day:
Should we be surprised by this level of participation? NO.
When we see extreme outflows like in early April, the expectation is that forced buying is around the corner.
The Big Money Phases chart below explains this beautifully. Phase 4 destruction is ultra-rare and precedes Phase 1 FOMO-style rallies:

Now that stocks are overbought should we be worried?
Not exactly.
Since 2014, we’ve had 17 instances where the BMI clocked overbought conditions. The average overbought stay is 21 trading sessions…about a month.
What that means is this: Under-the-surface leaders have plenty of room to run.
It’s when we fall out of the red zone that stocks wobble.
This is why you need this indicator on your radar.
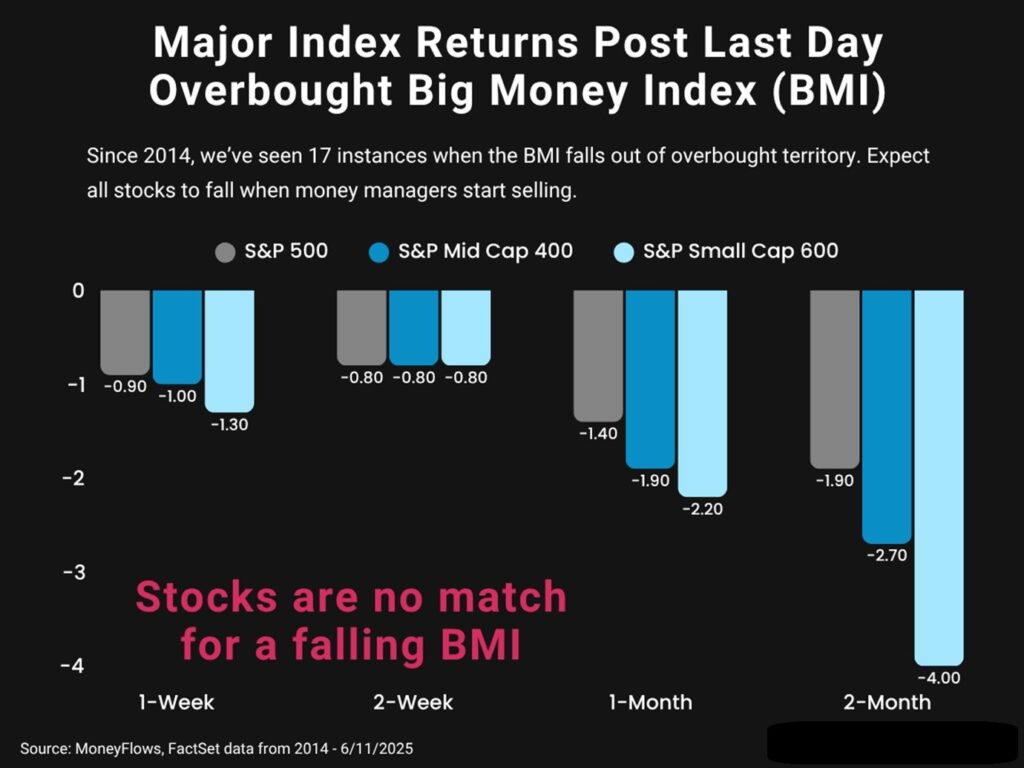
Below details the returns of the S&P 500, S&P Mid Cap 400, and S&P Small Cap 600 from the first day that the BMI falls below 80% (overbought).
There are 2 points to highlight:
- First, stocks are no match for a falling BMI. When money is fleeing markets, equities have nowhere to go but down.
- Second, prepare for stocks of all sizes to give back gains
Here you can see how large, mid, and small-caps struggle mightily from 1-week to 2-months after the BMI falls out of the red zone:
What’s the bottom line? Follow the money flows!
How should you play it? Simple.
Ride the wave until it crests…
Author: Lucas Downey