NASDAQ Golden Cross – June 26, 2025
The crowd is excited again.
Growth stocks are at all-time highs.
The latest development is the NASDAQ golden cross.
Wall Street has a lot to cheer about. Many of the world’s most important companies are breaking out to all-time highs.
Microsoft (MSFT), NVIDIA (NVDA), and Broadcom (AVGO) which lead the A.I. race, have soared to new heights (disclosure I hold a long position in MSFT).
And for good reason…analysts keep applauding their future earnings potential.
I believe those rosy estimates are still too low and massively underappreciate the acceleration in technological advancement.
Robotics, agentic A.I., physical A.I. and more are propelling stocks to levels few thought possible just 2 short months ago.
Prophets warned us of the dreaded death cross for equities in April. We found the opposite to be true and signaled an incredible upside opportunity.
Fortunately, we were on the right side of history on that non-consensus call. A crowd-stunning rally came to Wall Street like a thief in the night.
Today, we see a more cheerful setup for tech stocks with the NASDAQ forming a golden cross.
We’ll study history to learn what comes next.
Bear prayers are in order.
NASDAQ Golden Cross
Data has a way of cutting through the noise.
It offers real-time perspective when the world is upside down.
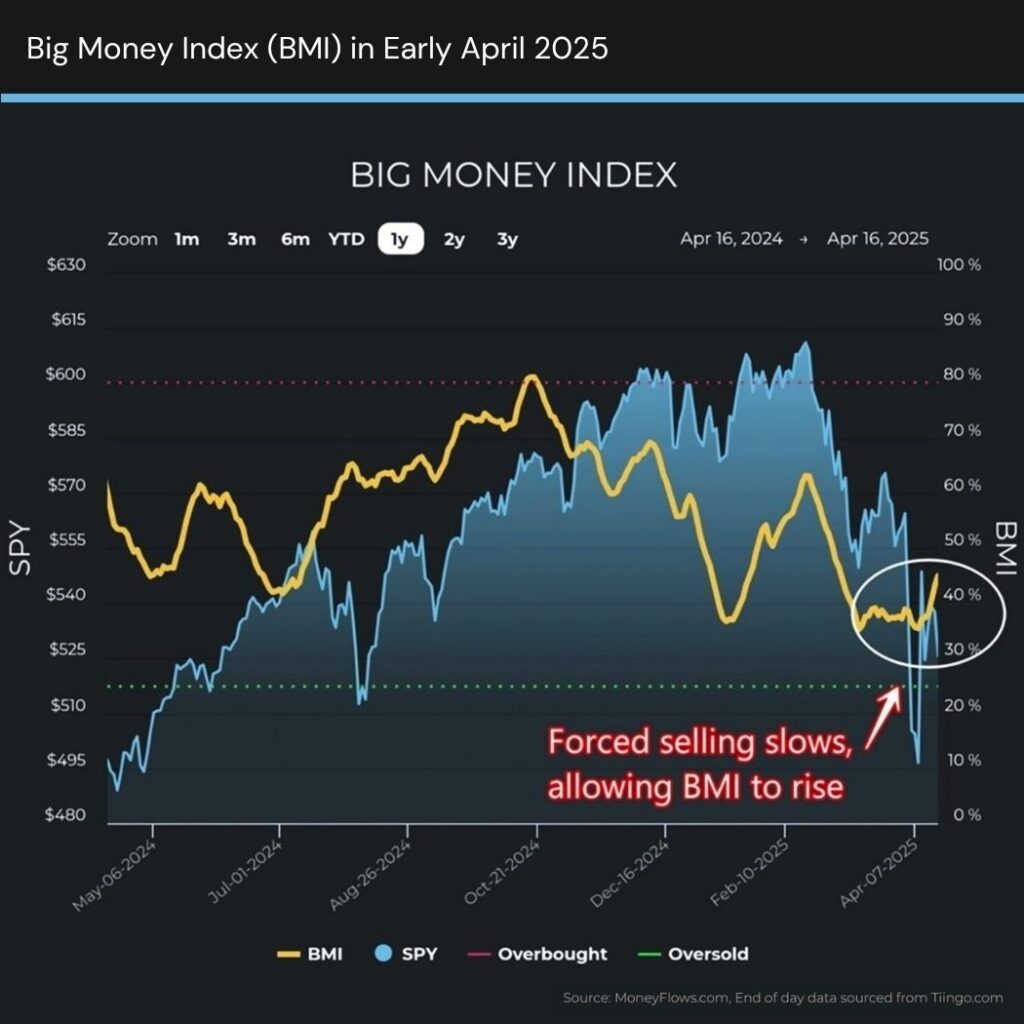
April’s death cross for the S&P 500 came at a time when the Big Money Index (BMI) was violently rising.
When money is flowing into stocks, markets have nowhere to go but up. It really is that simple.
Here’s where the BMI sat in early April. Notice the change of character in the BMI even as the S&P 500 was directionless:
You can review where we stood on the Death Cross.
Let’s now shift to the story of the day. The NASDAQ 100 just formed a golden cross. This occurs when the 50DMA crosses above the 200DMA.
Check it out:
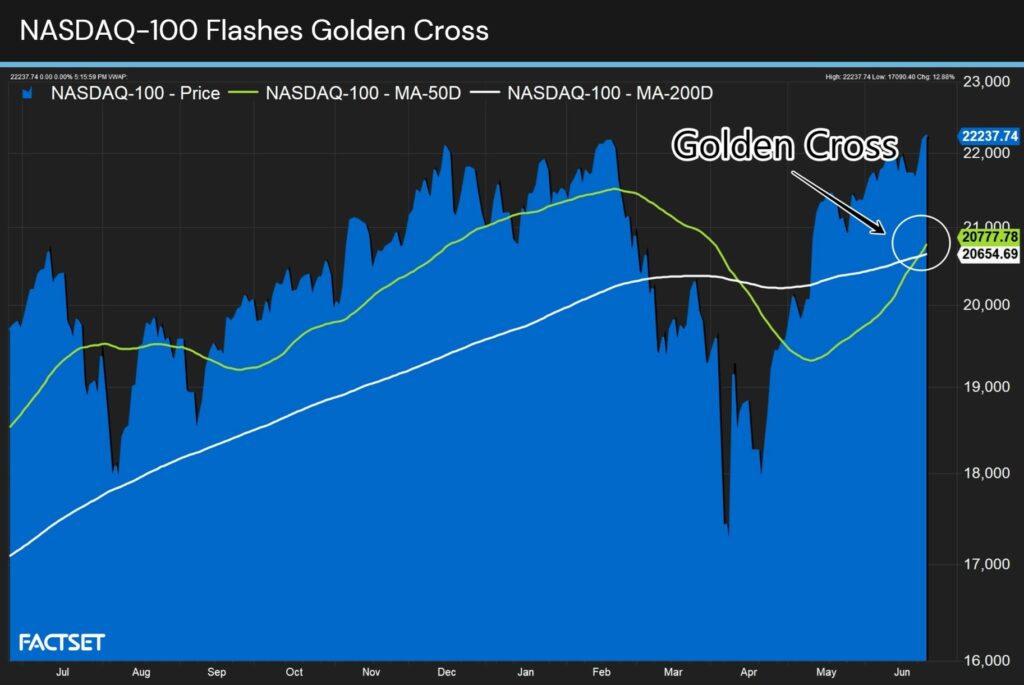
Using the eyeball test, it isn’t clear whether this setup suggests upside or downside.
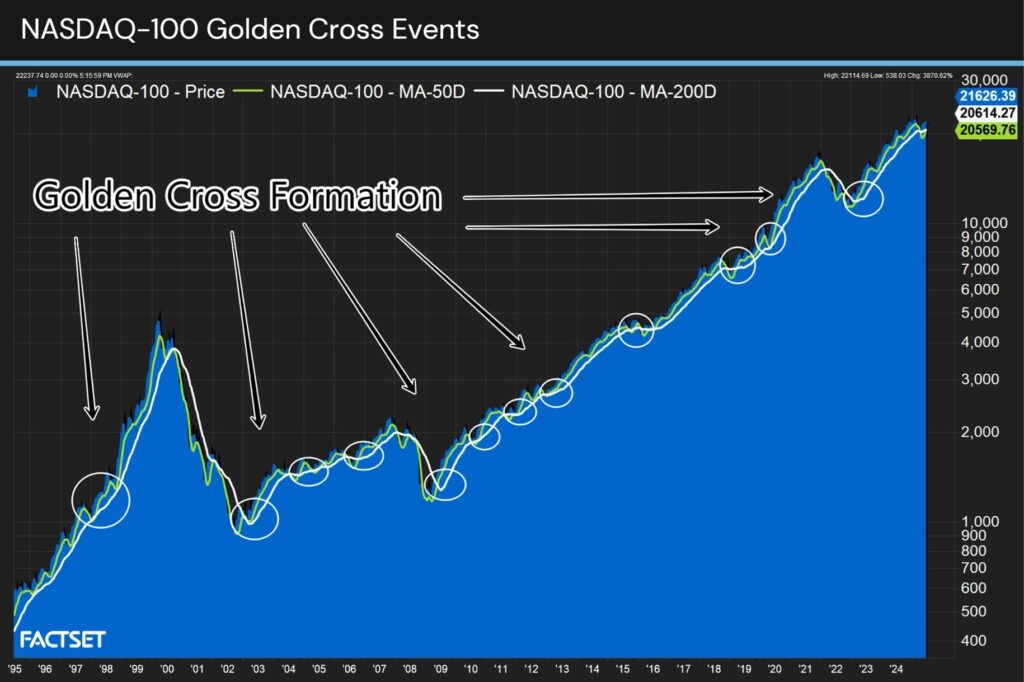
We need to zoom out for clues. Below plots all golden crosses for the NASDAQ 100 the last 30 years using weekly data.
There’ve been 17 golden crosses prior to this week’s formation:
What’s the verdict? Is the golden cross a holy setup for stocks?
Turns out it is!
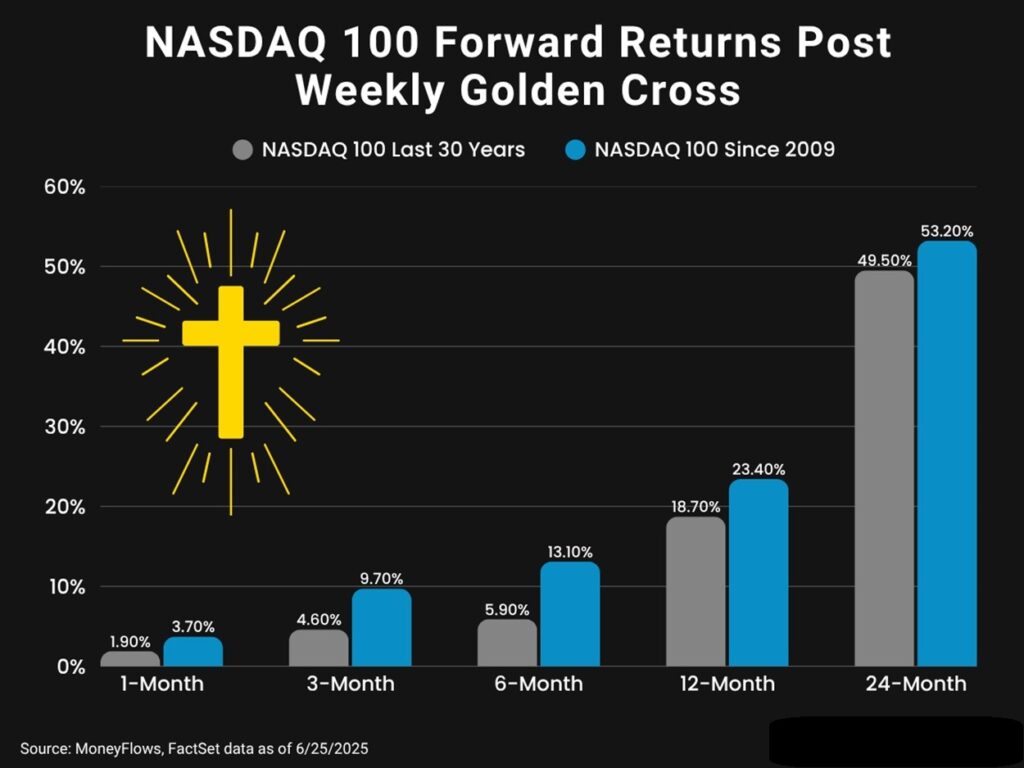
For today’s signal study I’ve grouped all golden crosses in the last 30 years and those from 2009.
What you’ll notice is that tech stocks continue to gain post a golden cross. Here are the forward returns post 2009:
- 3-months later NDX gains 9.8%
- 6-months later the NASDAQ jumps 13.1%
- 12-months after the average gain is 23.4%
- Be bold for 24-months and you’re staring at gains of 53.2%
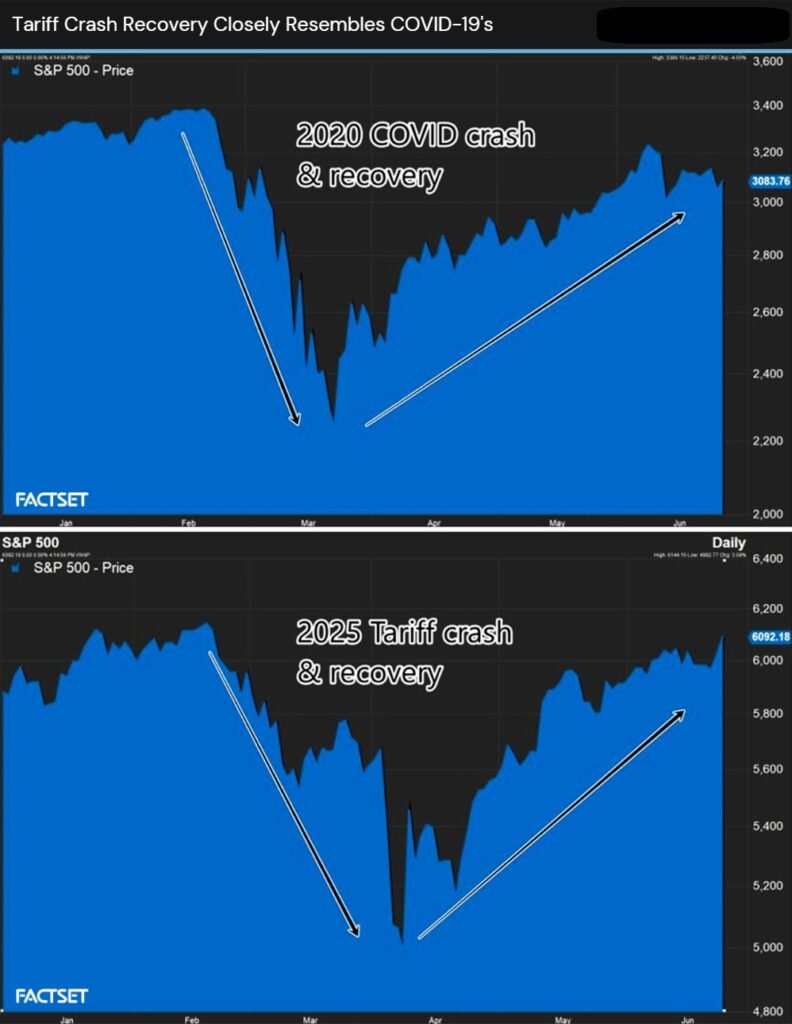
Now why am I focused on 2009 and later? Simple. The latest tariff crash and rip is following the COVID-19 analog to a tee.
Let’s use the S&P 500 for this analog. Notice the dump and bump in 2020 looks eerily similar to 2025:
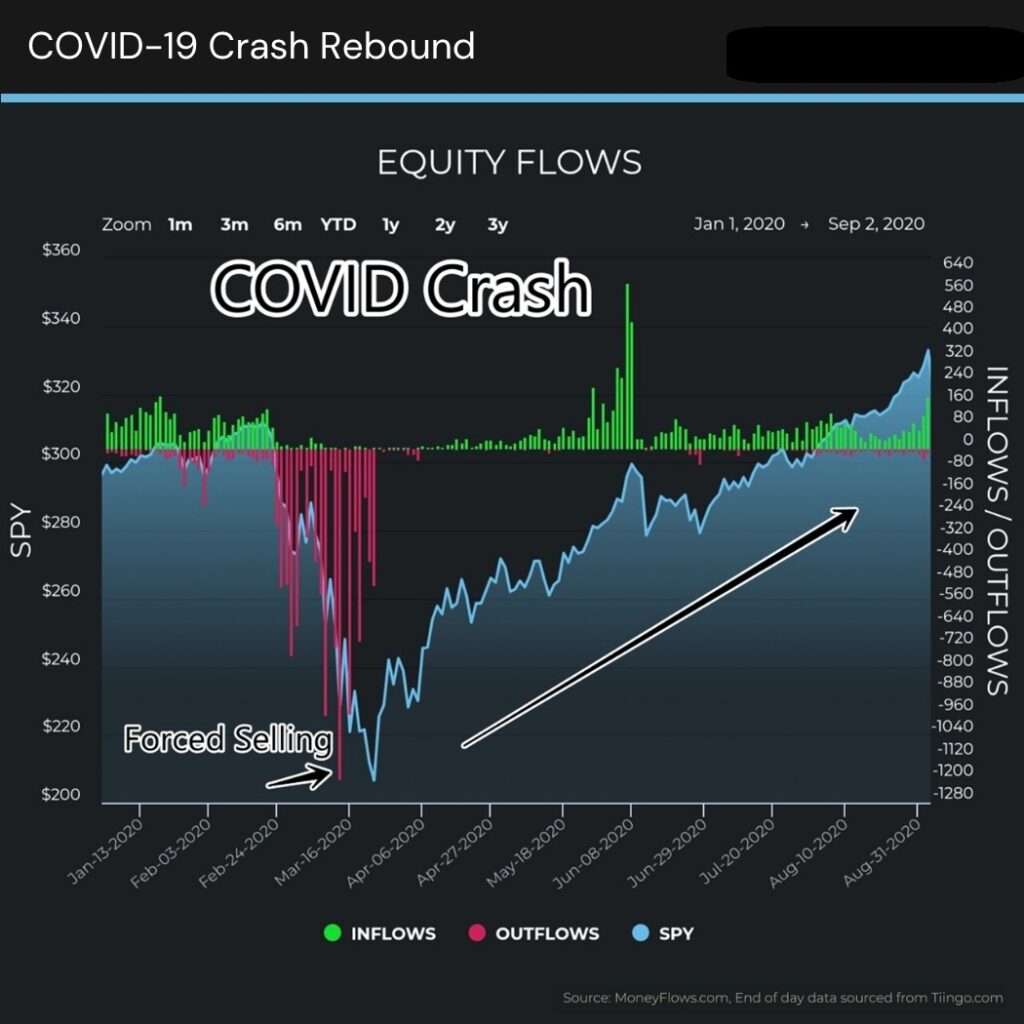
Not convinced? Now view it through the lens of MoneyFlows. Here’s the forced selling event of COVID-19.
Forced selling led to a blowoff top then further upside:
Now see the tariff crash. It’s déjà vu all over again:
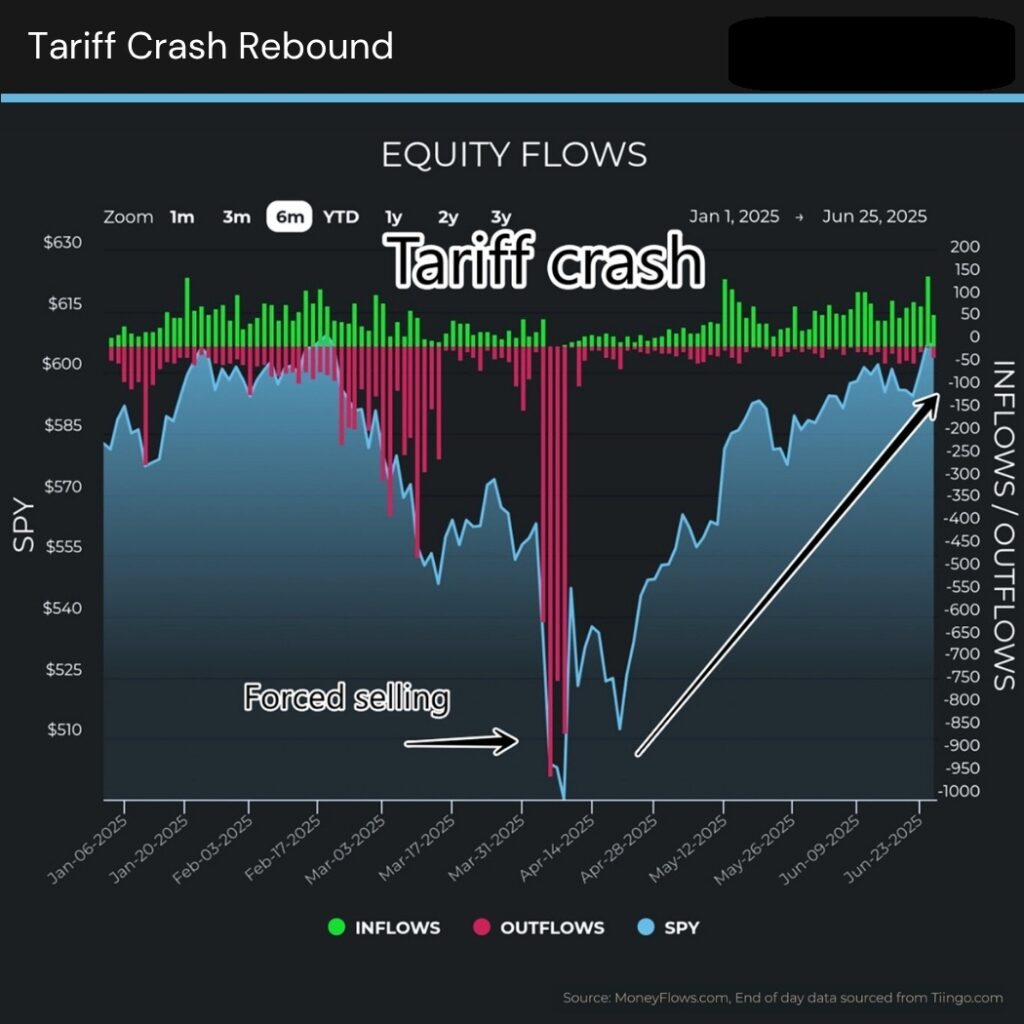
More importantly, those green bars are the discrete stocks that institutions are gobbling up. They are tomorrow’s leaders.
These elite small and mid-caps ARE NOT on the lips of the media. They are compounders.
They are companies with accelerating earnings.
They are companies with A.I. tailwinds.
They are outliers.
Author: Lucas Downey